Getting Started with VisualEther
From install to a real sequence diagram in a few minutes — free, no license required. Then unlock AI diagnosis and annotation on the same install.
This walkthrough takes you from a fresh install through three key features and out onto a capture of your own, each step building on the last:
- See a real protocol flow as a sequence diagram — three commands, no license.
- Ask Claude Code why a session failed — in plain English.
- Explain the flow message by message with AI-authored annotations.
- Apply all three to your own capture — Claude sets the project up for you.
Tracks 1 to 3 use the built-in BGP sample, but it's just one of the samples VisualEther ships. Run visualether list to see them all, and swap bgp for any one in the commands below; Track 4 moves to a capture of your own. Track 1 runs on the free Community edition. Tracks 2, 3, and 4 use the AI workflow in Professional and Server — and in the free 45-day trial, which includes the full paid feature set.
Not installed yet? Grab VisualEther for your platform on the download page (winget, Homebrew, apt, or dnf), then come back here. You also need Wireshark's tshark dissector — 4.6 or later recommended — which VisualEther uses to read captures. Verify both are ready:
visualether --version
tshark --version
Track 1 — See your first diagram
Runs on every edition, no license needed.
Everything below happens in a terminal. VisualEther has no application window to launch — if you just installed it and went looking for an icon, you haven't missed anything. On Windows, the installer does add a VisualEther Terminal shortcut to the desktop and the Start Menu, which opens a terminal with everything already on the PATH; on macOS and Linux, use your usual terminal.
Bootstrap a project from the built-in BGP sample and step into it:
visualether new bgp
cd bgp
visualether new bgp does it all in one step: it writes a small project — the capture, friendly router names, and two FXT templates: explore.fxt.xml, which renders the whole capture as a single diagram, and sessions.fxt.xml, which splits the same capture into individual sessions — then reads bgp.pcapng.gz through tshark and opens the rendered sequence diagram. It covers the whole capture — every BGP OPEN, UPDATE, KEEPALIVE, and the TCP transport underneath are drawn as a conversation between routers instead of a flat packet list.
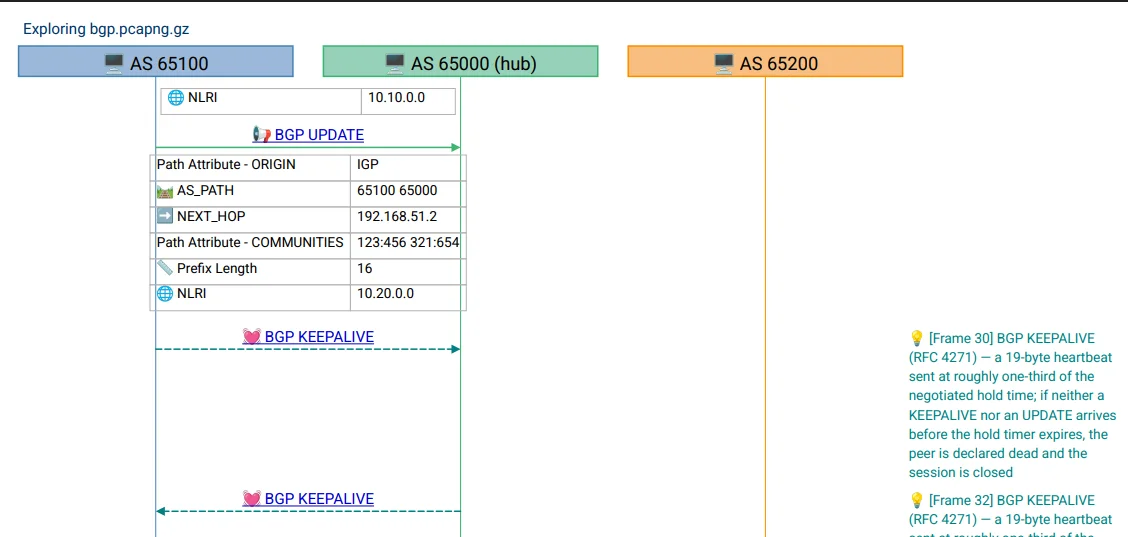
What you get depends on your edition. On Community edition, explore.fxt.xml renders the whole-capture diagram and opens it as a PDF; the sessions template is skipped, since per-session tracking is a paid feature. On the trial, Professional, or Server editions, both templates run and the interactive Capture Atlas opens in your browser, where you drill from the capture tree into any session. Browse a canned BGP Capture Atlas to see the expected output.
To point VisualEther at your own capture, drop a .pcap/.pcapng into the project and adjust both templates to match the protocols you care about — explore.fxt.xml for the whole-capture diagram, sessions.fxt.xml for the per-session split — then run visualether generate. With no arguments it picks up both templates and every capture in the project directory, so it's the one command to re-run after any template edit.
Rather not hand-edit XML? You don't have to — Track 4 hands the whole setup to Claude.
The complete manual ships inside every install — no download needed. Open it locally any time with:
visualether manualIt walks through writing an FXT template field by field, and documents every command and option. Prefer the web? The User's manual is the same content online.
Track 2 — Ask why a session failed
Professional, Server, or the free trial.
The explore diagram shows what happened. The next question is usually, why did it break? — and that's where Claude Code drives VisualEther through its built-in MCP server. Instead of you paging through packets, Claude extracts only the messages and fields that matter and reasons over them.
From the same bgp project directory, install the MCP server for the project, then launch Claude Code:
visualether mcp install --scope project
claude
Track 1 already built the session diagrams — visualether new ran sessions.fxt.xml alongside the explore template — so the sessions group is waiting in your capture tree. Ask Claude to read it:
Summarize the BGP sessions in this capture by outcome.Claude pulls VisualEther's session data and groups every session by outcome — success, failure, late, timeout, incomplete. Then the question that matters:
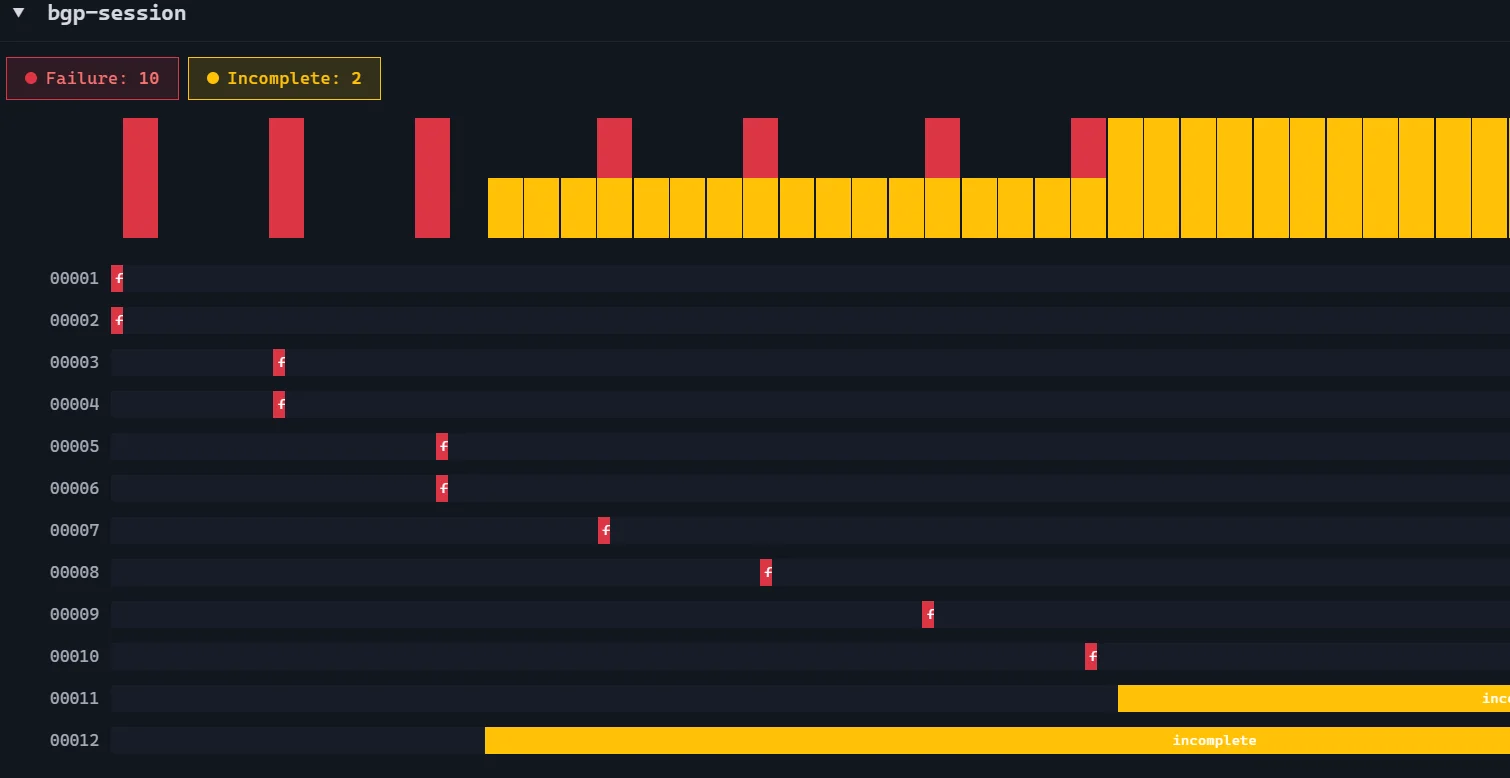
Why did the BGP sessions fail?Claude reads the extracted data and answers with the evidence: 10 of the 12 sessions failed as TCP resets — the router's SYN to port 179 is answered with RST, ACK, so the peering is refused before a single BGP message is exchanged. That's the classic "BGP neighbor not configured / nothing listening on port 179" bring-up failure. The 2 sessions that did establish completed OPEN → KEEPALIVE → UPDATE with a real route exchange — the capture ends before they close.
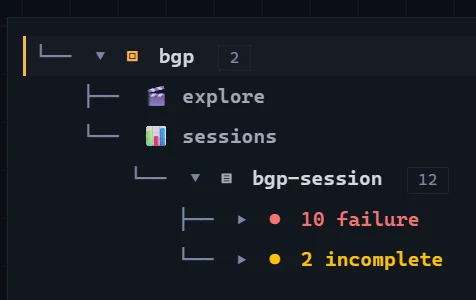
The navigator is a triage view, not just a list. It opens on the verdict — every session in the capture sorted into the five outcome buckets:

Below them, the session timeline places each one in time, and the shape of the failure is visible before you read a packet: the ten refused peerings barely register — a SYN answered by an RST, over in a sliver — while the two that established open partway through the capture and are still running when it ends.
Click any row and that session opens on its own — just its packets, on its own clock:
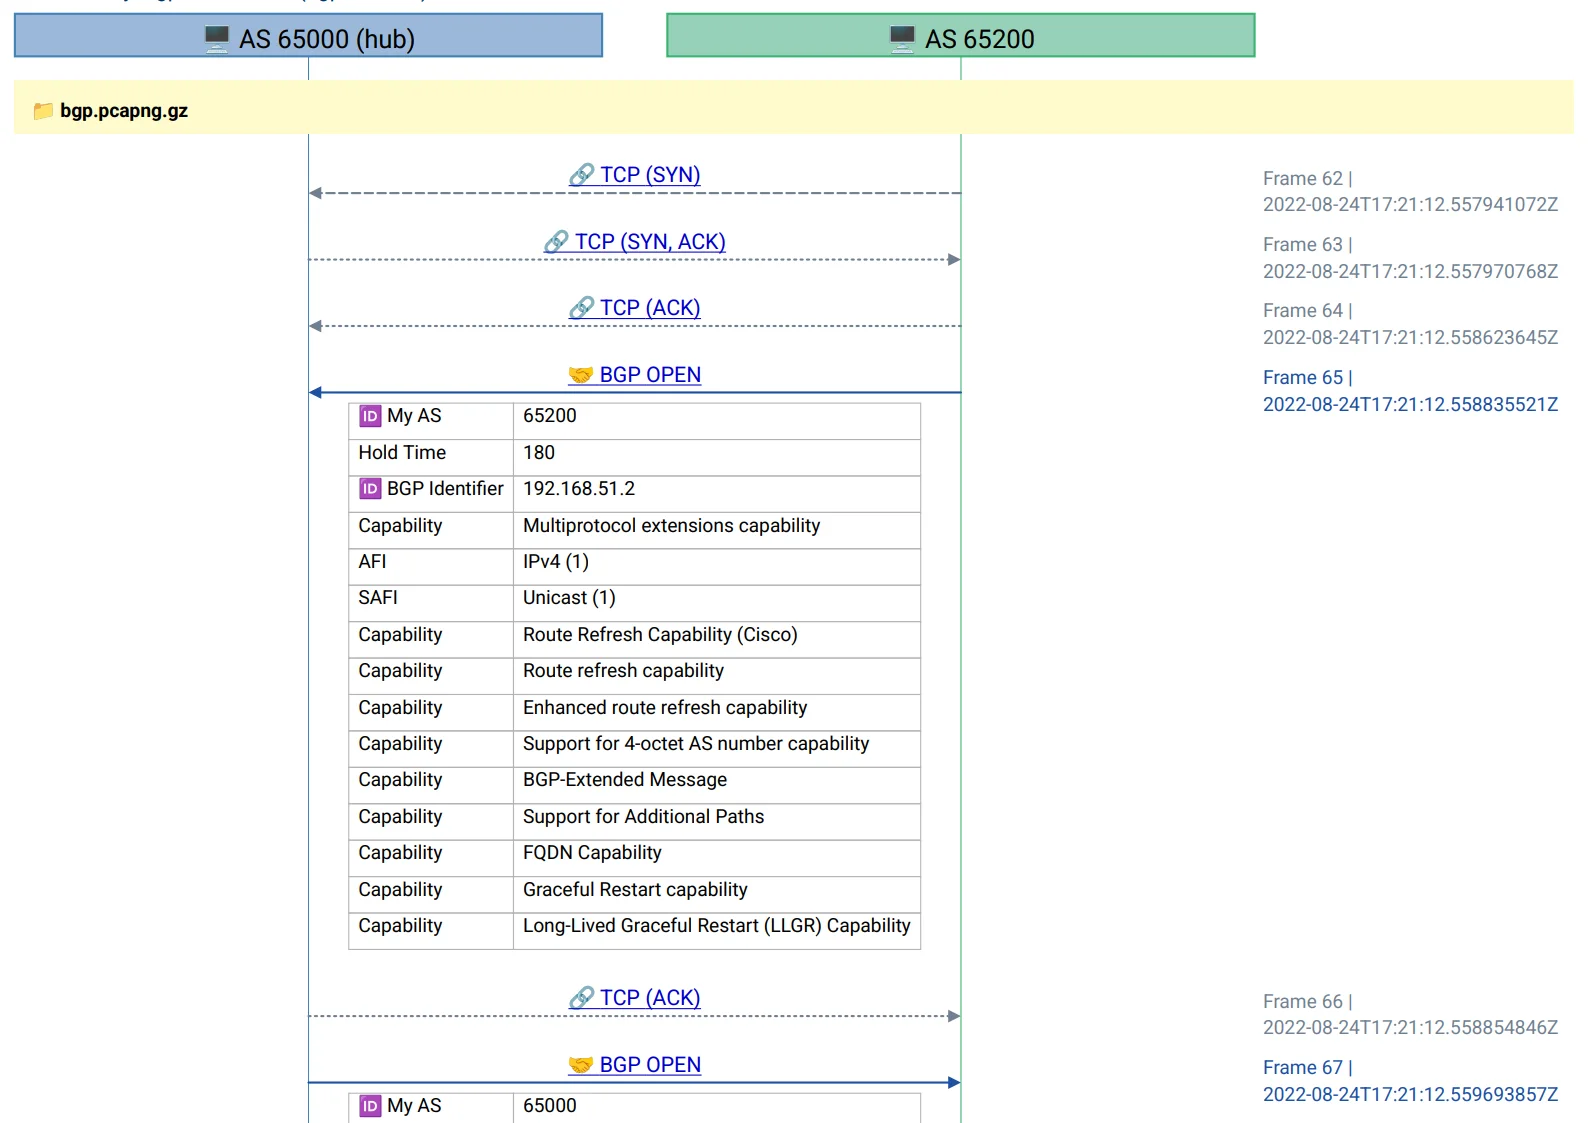
OPEN that negotiates hold time and capabilities. Open the live session.Running Community and want to try this? A free 45-day trial unlocks the MCP server, session tracking, and unlimited output on the installed version.
Track 3 — Explain the flow, message by message
Professional, Server, or the free trial.
Tracks 1 and 2 read the flow and diagnose it. The final step teaches it: ask Claude Code to annotate the capture, and every arrow on the diagram gets its own plain-English caption — an AI-authored explanation rendered right onto the sequence diagram. There are two ways to use it.
Explain a feature end to end. Point Claude at the whole capture:
Annotate this capture to explain what BGP is doing, message by message.Claude reads the entire flow, then writes a per-message remarks file and renders an annotated diagram: what the OPEN negotiates, what each UPDATE advertises, why the KEEPALIVE cadence matters. It's the fastest way to turn a capture into a teaching artifact for a colleague, a ticket, or a review.
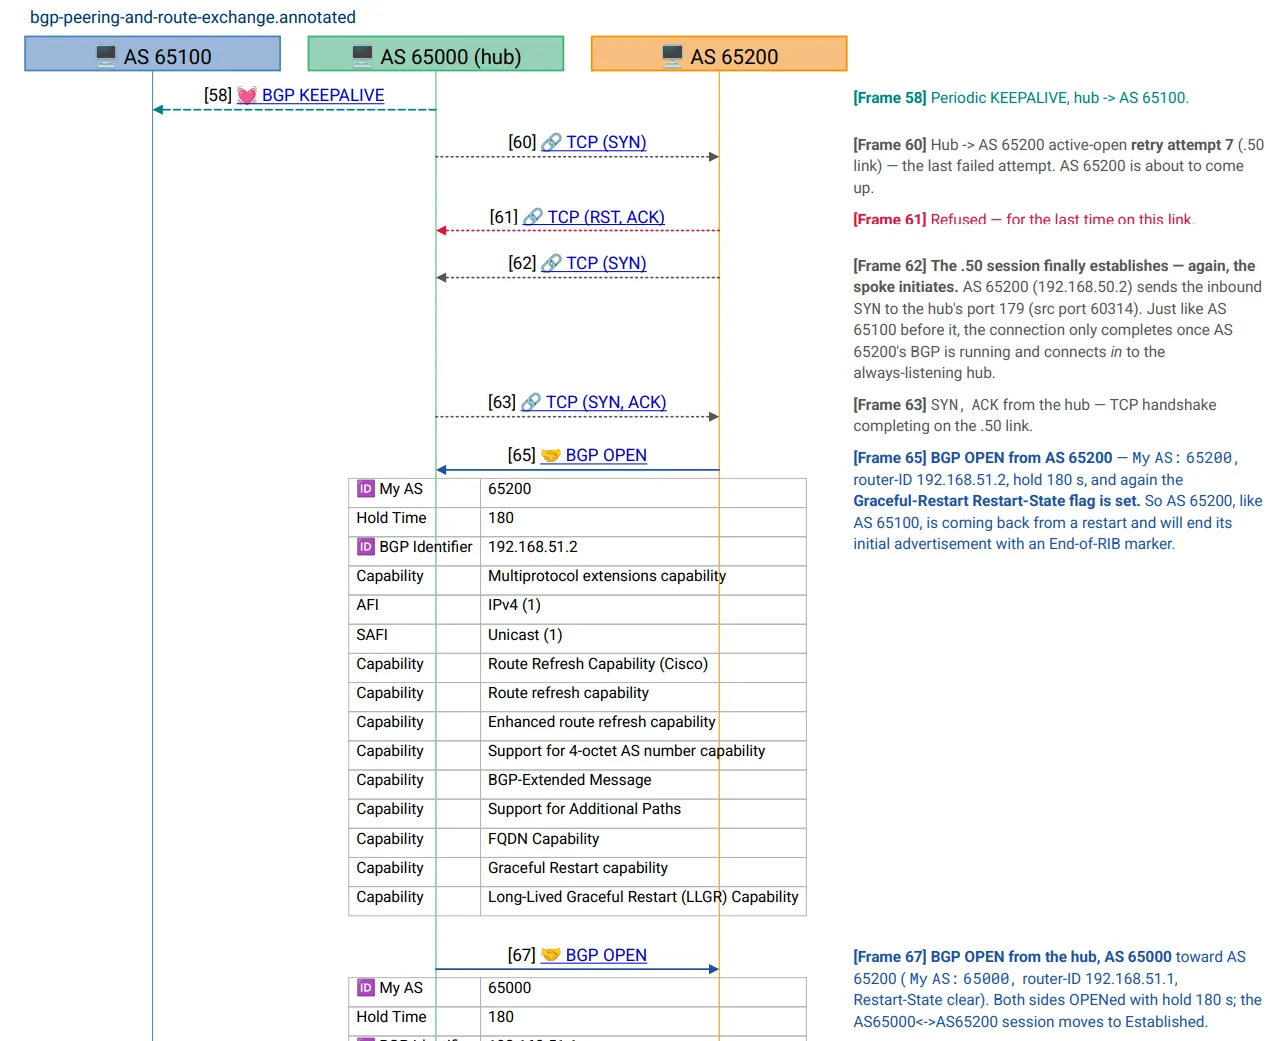
Walk through one failed session. When you're staring at a single broken session and want it explained, annotate just that one. Open the Session Navigator (from Track 2), expand the failure group, and click Copy Key on the session you want — the button appears when you hover over a row.
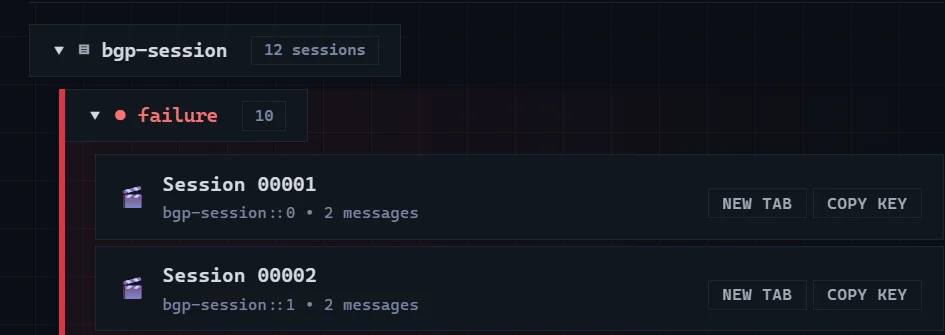
Then give that key to Claude:
Annotate the bgp-session with key <paste the copied key> and walk me through why it failed.Claude annotates only that session — for a refused BGP peering, a tight two-message story: the router dials port 179, the peer answers with RST, and the session is over before BGP starts.
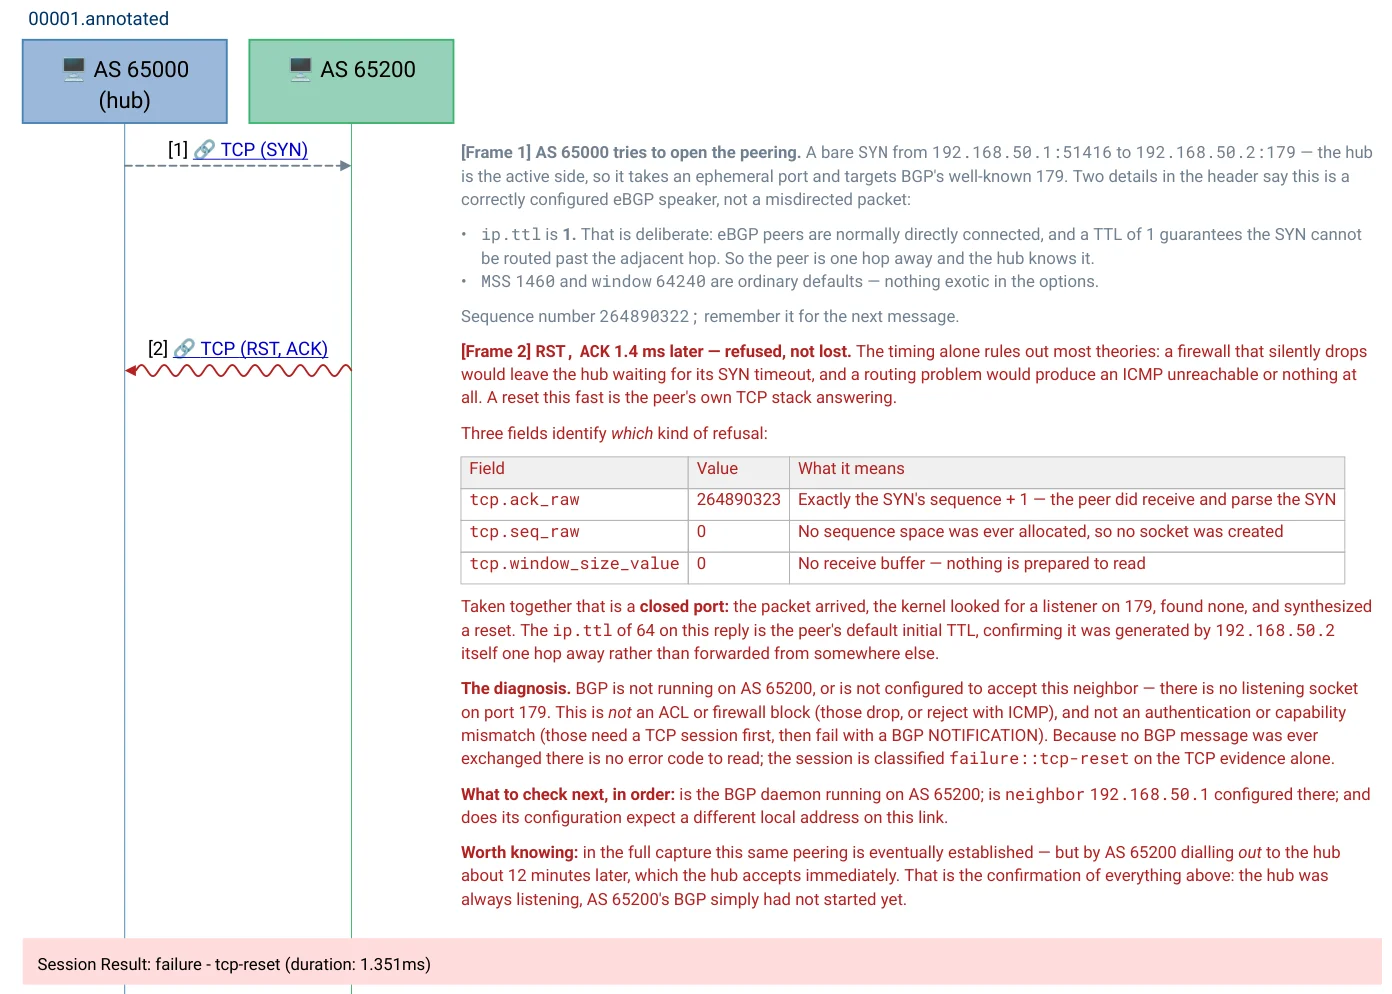
These annotations do more than label the arrows — they carry Claude's diagnosis. It correlates across layers and spells out why the flow behaved the way it did, so an annotated diagram is a head start on the debugging. The remarks stay an AI-authored draft for expert review — to correct one, edit its .remarks.md file and regenerate the diagram.
See a finished annotation. Here is that exact bgp capture, annotated end to end in your browser — every message carries a plain-English caption, and clicking any arrow opens its full Wireshark field tree. It's the output of the Explain a feature end to end workflow above, on the same sample you've been using. For the full write-up, see the BGP peering and route exchange walkthrough.
Track 4 — Run it on your own capture
Professional, Server, or the free trial.
Everything so far ran on a sample that arrived pre-configured. Your own capture arrives bare: no templates, no host names, no project file. Setting that up is the one job visualether new can't do for you — it builds projects from the bundled samples only. Claude does it instead.
First register the MCP server for every directory rather than just the bgp project:
visualether mcp install --scope userThen change into the directory holding your capture, start Claude Code, and ask:
Set up the explore and sessions FXT files and hosts.txt for <your-capture>.pcapngClaude reads the capture through tshark to see which protocols are in it, matches that against the samples VisualEther ships, and copies the closest match's explore.fxt.xml and sessions.fxt.xml in beside your capture. It pulls the endpoints out of the same capture and writes hosts.txt, so the diagram shows names instead of bare IP addresses. Finally it validates both templates against your actual packets and writes visualether.toml — which is what lets the project run with no flags at all:
visualether generateYour directory now holds a complete VisualEther project:
my-capture/
├── my-capture.pcapng    your capture, untouched
├── explore.fxt.xml      renders the whole capture as one diagram
├── sessions.fxt.xml     splits the same capture into sessions
├── hosts.txt            maps addresses to friendly names
├── visualether.toml     project config — why `generate` needs no flags
├── .gitignore           keeps output/ out of version control
└── output/              the rendered diagrams, a build product
Everything above output/ is worth committing: the templates and host names are the work, and the diagrams rebuild from them in seconds.
Two things worth knowing. On a very large capture or one with dozens of endpoints, Claude will skip hosts.txt rather than invent names for traffic you never asked about — say the word and it will write one anyway. And when nothing in the sample library covers your protocol, Claude falls back to authoring the templates from scratch: it reads the FXT syntax reference that ships with VisualEther, extracts the available fields from your capture, writes the pair, and validates them against your packets before rendering anything.
The templates are yours from that point on — plain XML sitting next to your capture, documented field by field in visualether manual, and re-rendered by visualether generate whenever you change them.
From here, Tracks 1 to 3 run unchanged on your own data: the Capture Atlas opens on your flow, why did these sessions fail? reads your packets, and an annotation pass turns your capture into something you can hand to a colleague.
Which track fits my edition?
One download, three editions — the running binary picks the edition from the license it finds:
- Community (free, no license) runs Track 1 today: PDF sequence diagrams from any capture, up to 30 pages and 10 entities.
- Professional / Server add Tracks 2, 3, and 4: the MCP server for project setup, AI diagnosis, and annotation, browser-based session triage, all output formats, and unlimited output.
- The free 45-day trial carries the complete paid feature set, so you can run all four tracks before deciding. It activates on the same install.
Next step
Unlock diagnosis and annotation
You've seen Track 1 run free on Community. Add a 45-day Professional trial key to the same executable to unlock the AI workflow behind Tracks 2 and 3 — ask why a session failed, and annotate any flow message by message.
Where to go next
- Compare the editions — the full Community vs Professional vs Server feature table.
- Use VisualEther with any MCP client — Cursor, Windsurf, VS Code, Codex, Gemini CLI, Claude Desktop, and Zed setup.
- Examples and case studies — live Capture Atlases and narrated AI analysis on real captures.
- The User's manual
— the complete reference for FXT templates, session tracking, and the CLI. Open it locally with
visualether manual.