Debugging software crashes
Debugging software crashes is one of the most difficult parts of real-time and embedded software development. Software crashes when an application performs an illegal operation and the operating system is forced to abort the execution of the application. Here we will discuss several causes of crash in typical embedded application. A good understanding of C to assembly would be helpful in understanding the content described here.
Here we focus on memory corruption crash symptoms. We will also look at the special considerations in debugging C++ code crashes. Finally we will look at techniques to simplify crash debugging.
The following software problems lead to crashes:
Invalid Array Indexing
Invalid array indexing is one of the biggest source of crashes in C and C++ programs. Both the languages do not support array bound checking, thus invalid array indexing usually goes undetected during testing. Out of bound array indexing will corrupt data structures that allocated memory after the array. Another point often missed in analyzing array indexing problems is the fact that invalid array indexing can corrupt data structures declared before the array. This happens when the array is indexed with a very large unsigned number that represents a negative number in signed arithmetic. Consider an array b which is accidentally indexed with the number 0xFFFFFFFF, Since array index is considered to be a signed integer, this access will be treated as an access to -1 index. Thus this access will corrupt variables declared before the array, i.e. memory allocated to a. If the array is indexed with an index greater that 99, it will corrupt c.
Array declaration
Un-initialized Pointer Operations
Un-initialized pointer operations are also a big reason for crashes in C and C++ programs. This problem is so acute that languages like Java and C# do not permit pointer operations. If a pointer is not initialized before access, this can result in corrupting pretty much any area of the memory. Sometimes this can result in hard to detect crashes as the pointer causing memory corruption might be located in completely unrelated area of the code. Also, un-initialized pointers can lead to unexpected behavior when the memory map of the application is modified. This happens if an un-initialized pointer operation was corrupting a unused memory block. Shifting the memory map or resizing of data structures might cause the corrupting pointer access to modify used memory. This type of problems should be suspected when a developer has just changed the size of some data structure and a stable application starts crashing.
A special case of this problem is invalid access resulting with an attempt to read or write using a NULL pointer. Here the detection of the problem is very much hardware dependent. On some platforms, accessing memory for read or write using in NULL pointer will result in an exception. On other platforms, read using a NULL pointer might go undetected but a write operation results in a crash. In yet other architectures, read and write accesses using NULL pointers might go undetected.
Another special condition is described below. If UpdateTerminalInfo is called with an un-initialized pointer, there is a possibility that the program does not crash when status is updated in the structure but it crashes in UpdateAdditionalInfo when the info variable is updated. This can happen if the beginning of the structure maps to a valid address but following elements map to illegal addresses.
Uninitialized pointer
Unauthorized Buffer Operations
Many times applications free an area of memory but continue to use a pointer to the memory. This can result in hard to detect crashes as the buffer might have been reallocated to some other application. This might lead to unexpected behavior in a different application. Sometimes this might also cause a crash in the memory management subsystem of the operating system as unauthorized buffer access might corrupt the heap management data structures.
A special case of unauthorized buffer operations is covered below. Here the buffer is freed up in the function and an access is attempted to the buffer after freeing it. This type of problem might go undetected and might even be harmless on some systems. However in a multi-threaded design, the buffer might have already been allocated to a different thread!
Unauthorized buffer operation
Illegal Stack Operations
Illegal stack operations can lead to hard to detect crashes. This typically takes place when a program passes a pointer of the wrong type to a function. The example given below shows a case of a function expecting an integer pointer and the caller passes a pointer to a character.
char pointer/int pointer mixup
Invalid Processor Operations
Processors detect various exception conditions and abort program execution when they detect an error condition. A few of these conditions are:
- Divide by zero attempted by application
- Program running in user mode attempted to execute an instruction that can only be executed in supervisor (kernel) mode.
- Program attempted access to an illegal address. The address might be out of range or the program might not have the privilege to perform the access. For example, a program attempting to write to read only segment will result in an exception.
- Misaligned access to memory also results in an exception. Most modern processors restrict long word reads to addresses divisible by 4. An exception will be raised if a long word operation is attempted at an address that is not divisible by 4. (See the byte alignment and ordering article for details)
Infinite Loop
When a program enters an infinite loop, it might crash due to invalid array indexing when the loop index exceeds the array bounds and corrupts memory. In other scenarios, the program continues to loop until a watchdog kicks in and aborts the program. If watchdog functionality is not supported, the system will "hang" and never recover from the error. Thus all embedded systems must be designed to support watchdog reset functionality.
See the article on fault handling techniques for more details about watchdog handling.
Debugging Memory Corruption
Programs store data in any of the following ways:
| Global | All variables of objects declared as global in a C/C++ program fall into this category. This also includes static variable declarations. |
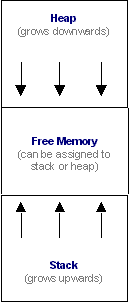
| Heap | Memory allocated using new or malloc is allocated on the heap. In many systems, stack and heap are allocated from opposite sides of a memory block. (See the figure below) |
| Stack | All local variables and function parameters are passed on the stack. Stack is also used for storing the return address of the calling functions. Stack also keeps the register contents and return address when an interrupt service routine is called. |

Memory corruption in the global area, stack or the heap can have confusing symptoms. These symptoms are explored here.
Global Memory Corruption

If a global data location is found to be corrupted, there is good chance that this is caused by array index overflow from the previous global data declarations. Also the corruption might have been caused by an array index underflow (array accessed with a negative index) from the next variable declarations. The following rules should be helpful in debugging this condition:
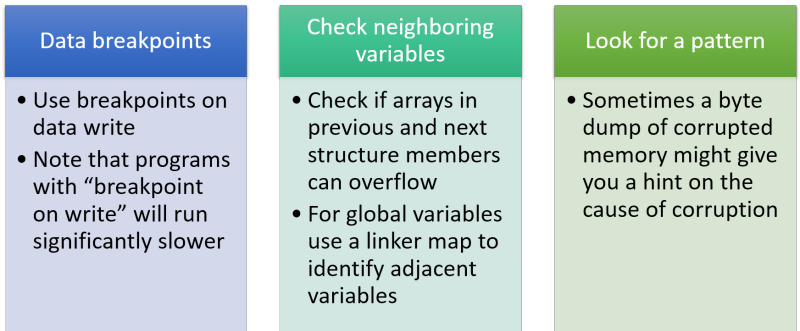
- If you have a debugging system which allows you to put breakpoints on data write to a certain location, use that feature to find the offending program corrupting the memory. If you don't have the luxury of such a tool, the following steps might help.
- If the variable is a part of structure, check if overflow/underflow of previous or next variables in the structure could have caused this corruption.
- If other structure member access seems harmless, use the linker generated symbol map to locate other global variables declared in the vicinity of the corrupted structure. Examine the data structures to determine if they could have caused the corruption.
- Sometimes looking at the corrupted memory locations can also give a good idea of the cause of corruption. You might be able to recognize a string or data pattern identifying the culprit. This might be your only hope if the corruption is caused by an un-initialized pointer.
- Extent of corruption might also give a clue of the cause of corruption. Try to determine the starting and ending points of a corruption (only possible if the corrupting program is writing in an identifiable pattern).
Heap Memory Corruption
Corruption on the heap can be very hard to detect. A heap corruption could lead to a crash in heap management primitives that are invoked by memory management functions like malloc and free. It might be very hard to detect the original source of corruption as the buffer that lead to corruption of adjacent buffers might have long been freed. Guidelines for debugging crashes in heap area are:
- If a crash is observed in memory management primitives of the operating system, heap corruption is a possibility. It has been observed that memory buffer corruption sometimes leads to corruption of OS buffer linked list, causing crashes on OS code.
- If a memory corruption is observed in an allocated buffer, check the buffers in the vicinity of this buffer to look for source of corruption.
- Corruption of buffers close to heap boundary might be due to stack overflow or stack overwrite leading to heap corruption (see the above figure)
- Conversely, stack corruption might take place if a write into the heap overflows and corrupts the stack area.
Stack Memory Corruption

Stack corruption by far produces the most varied symptoms. Modern programming languages use the stack for a large number of operations like maintaining local variables, function parameter passing, function return address management. See the article on c to assembly translation for details.
Here are the rules for debugging stack corruption:
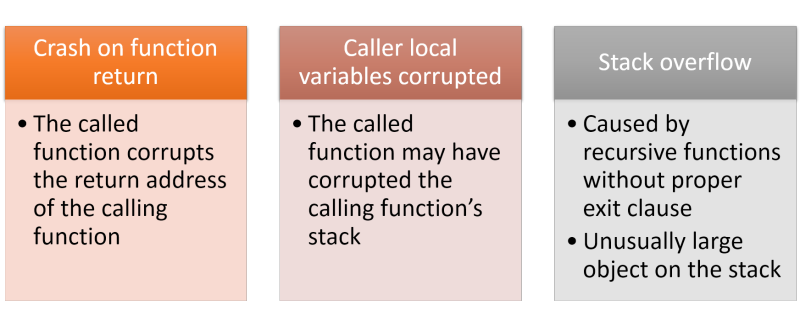
- If a crash is observed when a function returns, this might be due to stack corruption. The return address on the stack might have been corrupted by stack operations of called functions.
- Crash after an interrupt service routine returns might also be caused by stack corruption.
- Stack corruption can also be suspected when a passed parameter seems to have a value different from the one passed by the calling function.
- When a stack corruption is detected, one should look at the local variables in the called and calling functions to look for possible sources of memory corruption. Check array and pointer declarations for sources of errors.
- Sometimes stray corruption of a processors registers might also be due to a stack corruption. If a register gets corrupted due to no reason, one possibility is that an offending thread or program corrupted the register context on the stack. When the register is restored as a part of a context switch, the task crashes.
- Corruption in heap can trickle down to the stack.
- Stack overflow takes place when a programs function nesting exceeds the stack allocated to the program. This can cause a stack area or heap area corruption. (Depends upon who attempts to access the corrupted memory first, a heap operation or stack operation).
Crash Debugging in C++
We have been discussing crash debugging techniques that apply equally well to C as well as C++. This section covers crash debugging techniques that are specific to C++.
Invalid Object Pointer
Many C++ developers get confused by crashes that involve method invocation on a corrupted pointer. Developers need to realize that invoking a method for an illegal object pointer is equivalent to passing an illegal pointer to a function. A crash would result when any member variable is accessed in the called method.
In the example given below, when HandleMsg() is invoked for a NULL pX, the crash will result only when an access is attempted to member variables of X. There will be no problem in calling PrepareForMessage() or HandleYMsg() for Y pointer. (For more details on this refer to C and C++ article.
Corrupted Object Pointer Access
V-Table Pointer Corruption
Inheriting Classes
All classes with virtual functions have a pointer to the V-table corresponding to overrides for that class. The V-table pointer is generally stored just after the elements of the base class. Corruption of the v-table pointer can baffle developers as the real problem often gets hidden by the symptoms of the crash.
The figure above shows the declaration of class A and B. The figure below shows the memory layout for an object of class B. If m_array array is indexed with an index exceeding its size, the first variable to be corrupted will be the v-table pointer. This problem will manifest as a crash on invoking method SendCommand. The reason this happens is that SendCommand is a virtual function, so the real access will be using a virtual table. If the virtual table pointer is corrupted, calling this function will take you to never-never land.
For more details on v-table organization refer to C and C++ Comparison article.
Dynamic Memory Allocation
Many C++ programs involve a lot of dynamic memory allocation by new. Many C++ crashes can be attributed to not checking for memory allocation failure. In C++ this can be achieved in two ways:
- Handle out of memory exception
- Check for new returning a NULL pointer.
Simplifying Crash Debugging
Here are a few simple techniques for simplifying crash debugging:
Obtaining Stack Dump
Make sure that every embedded processor in the system supports dumping of the stack at the time of crash. The crash dump should be saved in non volatile memory so that it can be retrieved by tools on processor reboot. In fact attempt should be made to save as much as possible of processor state and key data structures at the time of crash.
Using assert
An ounce of prevention is better than a pound of cure. Detecting crash causing conditions by using assert macro can be a very useful tool in detecting problems much before they lead to a crash. Basically assert macros check for a condition which the function assumes to be true. For example, the code below shows an assertion which checks that the message to be processed is non NULL. During initial debugging of the system this assert condition might help you detect the condition, before it leads to a crash.
Note that asserts do not have any overhead in the shipped system as in the release builds asserts are defined to a NULL macro, effectively removing all the assert conditions.
assert usage
Defensive Checks and Tracing
Similar to asserts, use of defensive checks can many times save the system from a crash even when an invalid condition is detected. The main difference here is that unlike asserts, defensive checks remain in the shipped system.
Tracing and maintaining event history can also be very useful in debugging crashes in the early phase of development. However tracing of limited use in debugging systems when the system has been shipped